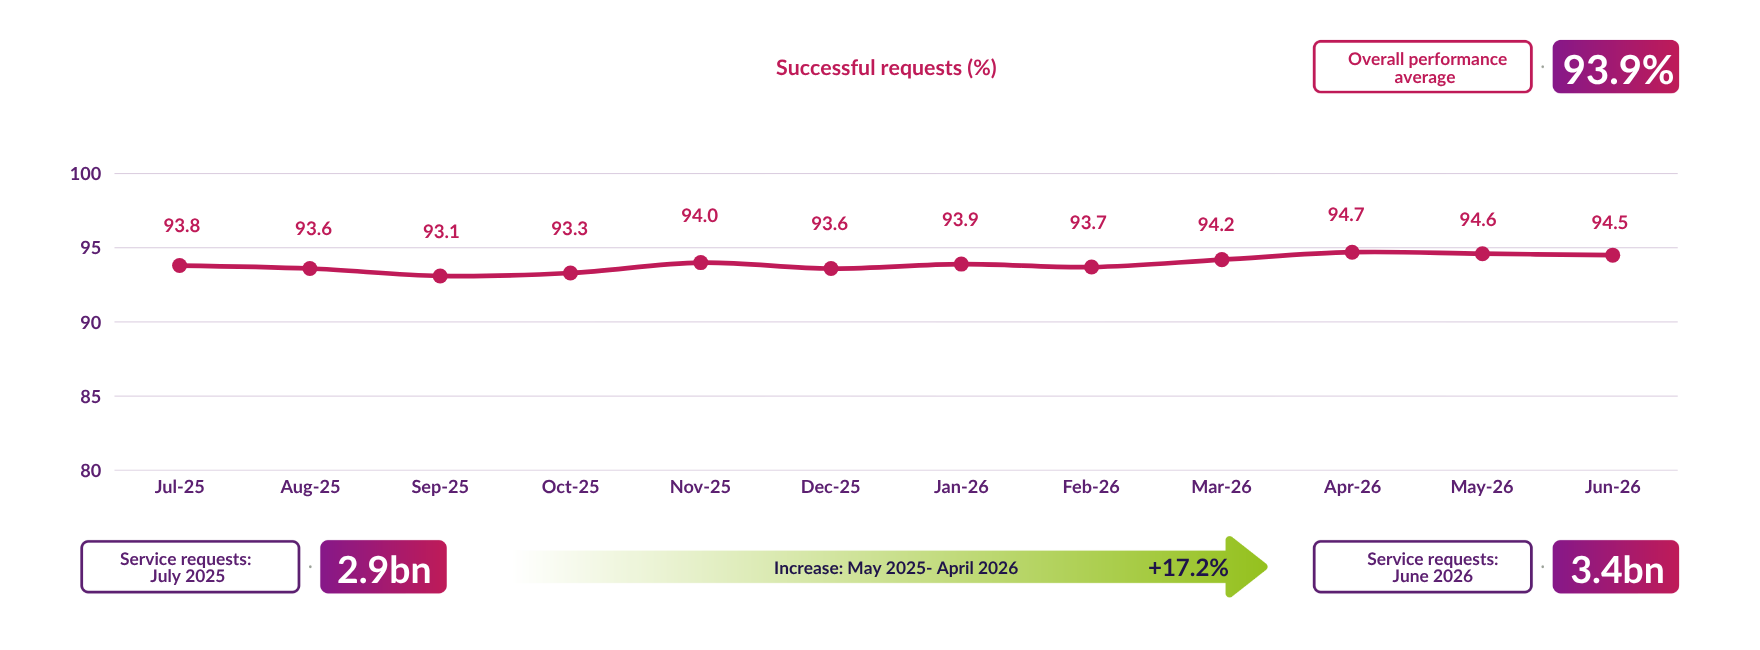
Service requests
These are 'commands' sent over the network to a smart meter, like a request for a meter reading. This graph shows the percentage of successful requests carried on the network, and the increase in volume over a year.
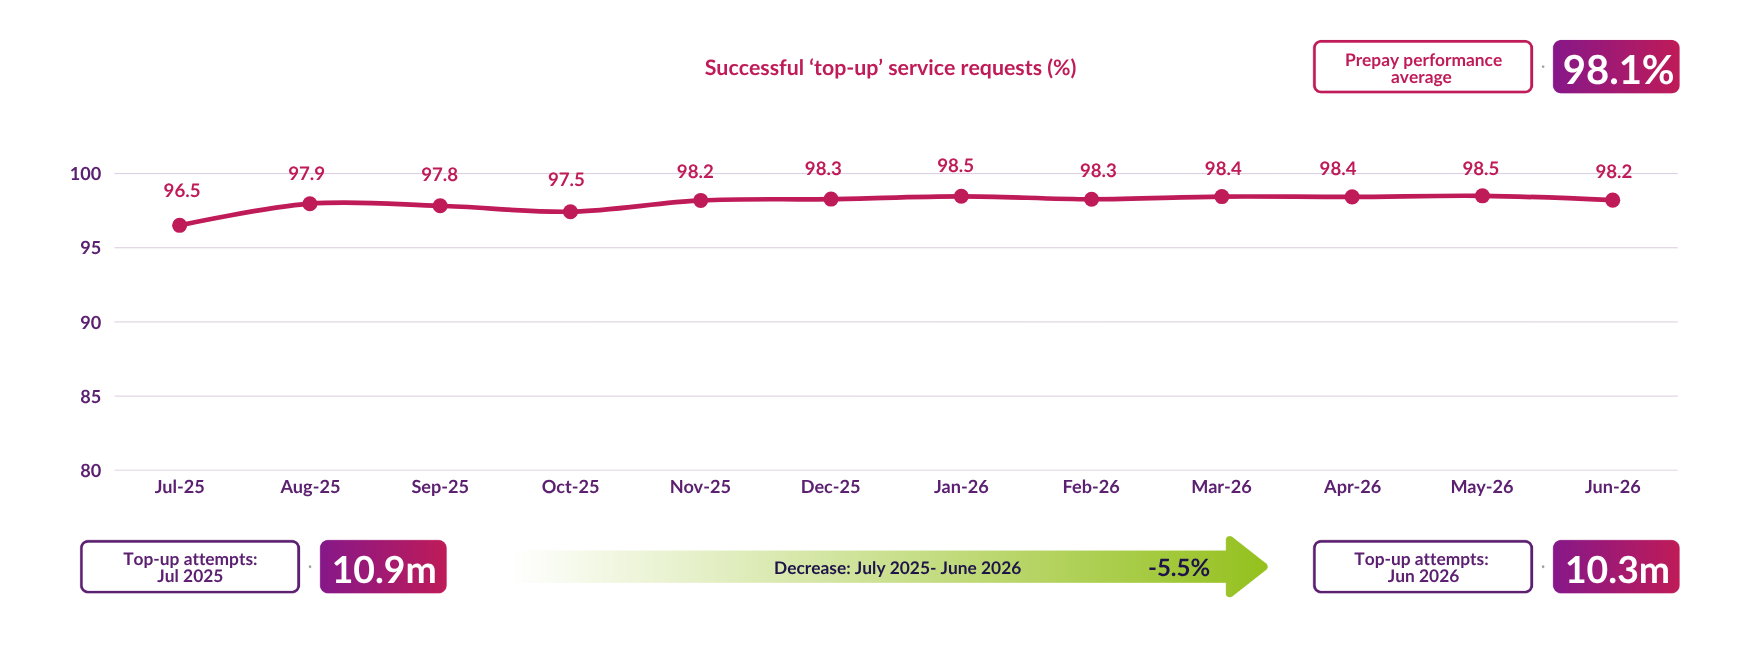
Successful 'top-ups'
Percentage of successful pre-pay 'top-up' requests carried on the network in the last year.
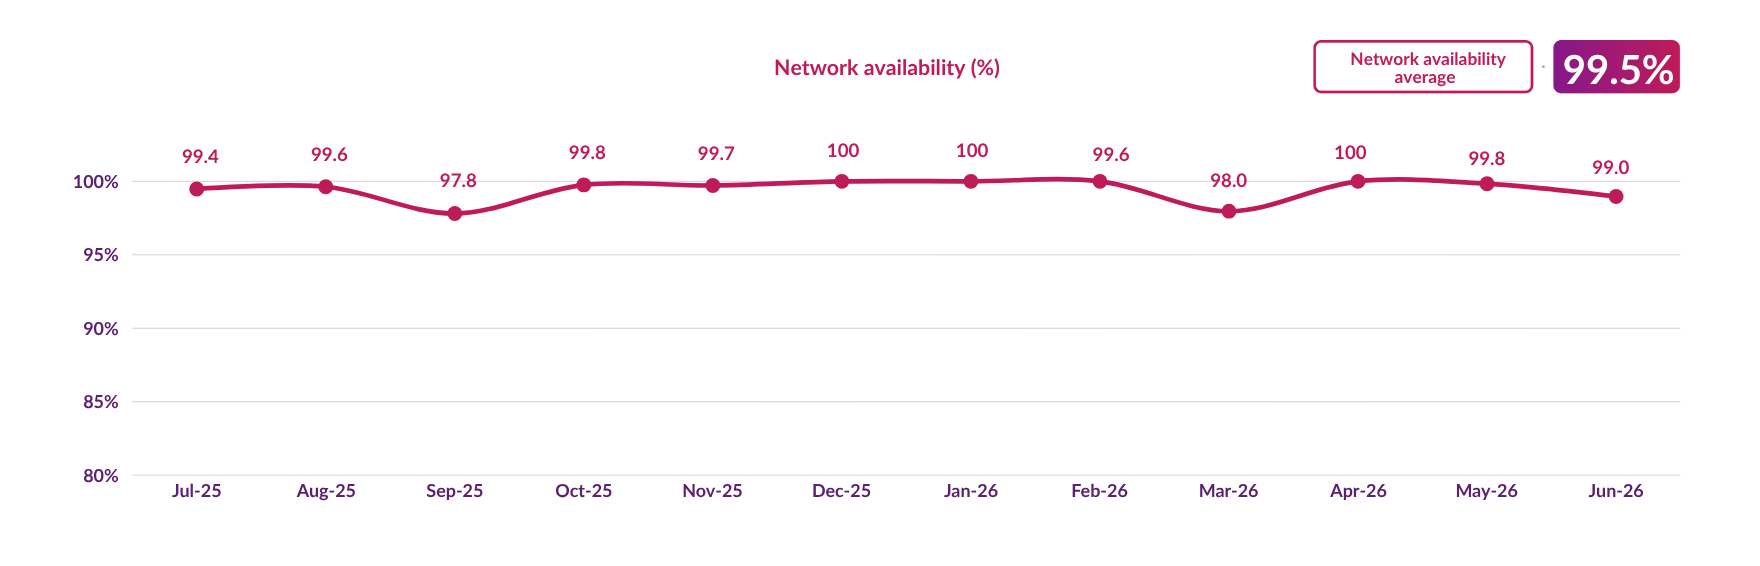
Network availability
Proportion of time when the network was operating as normal.
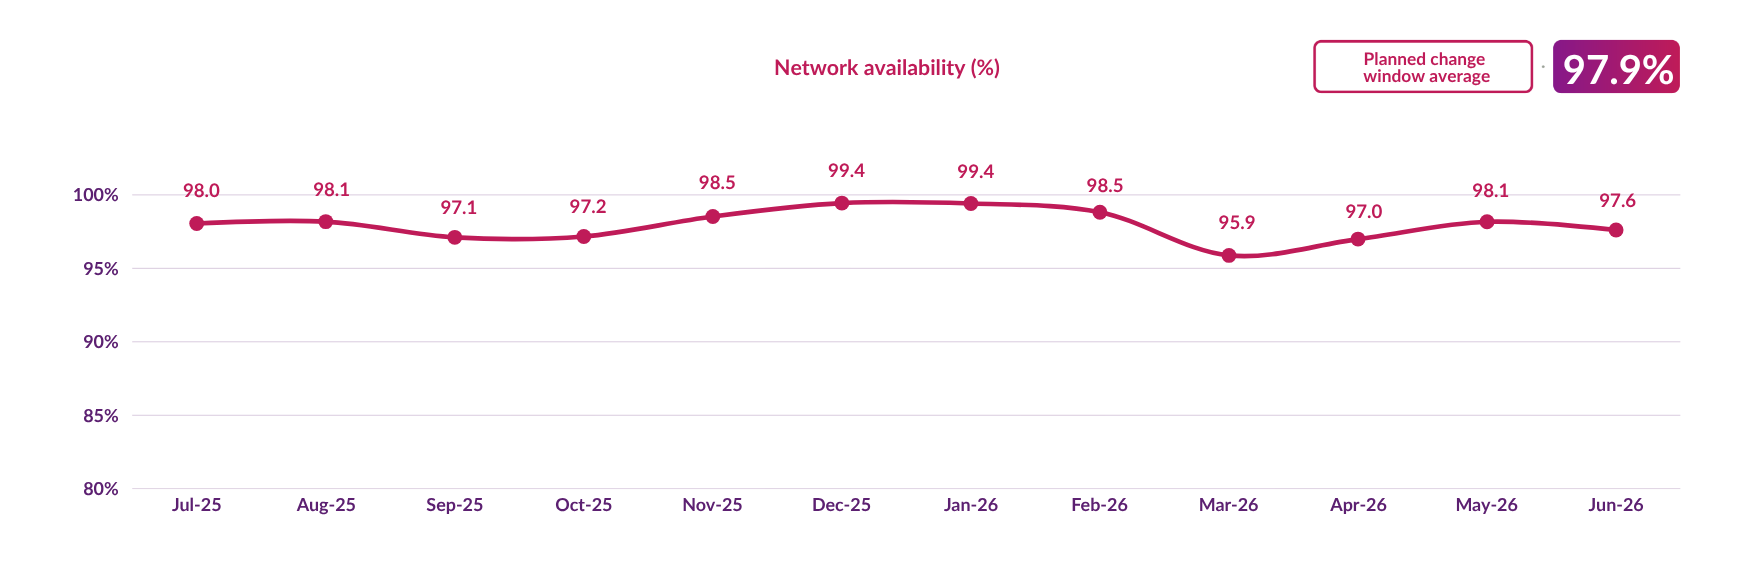
Network availability during planned changes
How often the network ran as normal during planned upgrades.
- Featured

Major incident management
As with any network, there are occasionally incidents which may impact performance and service availability. With 24/7 monitoring, we’re able to identify issues and begin to rectify them promptly
Read moreMore smart meter statistics
Follow progress in the smart meter roll-out through a set of fascinating facts and data points.
Read moreFurther reading